2 ESG Data
One inescapable step in the long journey of SRI is the gathering and processing of ESG-related data. The landscape of ESG data providers is diversified and encompasses both well-established players (e.g., Bloomberg, FTSE, MSCI, Thomson Reuters - Refinitiv, and Standard & Poor’s) and more specialized (if not niche) competitors such as:
-
Sustainalytics,
-
Vigeo EIRIS,
-
GRESB - Global ESG Benchmark for Real Assets,
-
Carbon4 Finance,
-
RepRisk,
- Truvalue Labs (bought by Factset) and
- Institutional Shareholder Services (ISS), part of Deutsche Börse,
to cite a few. In fact, the field is consolidating: for instance, MSCI has bought RiskMetrics (which owned KLD) and Carbon Delta, while S&P acquired Trucost and Morningstar got hold of Sustainalytics. Sustainalytics then bought Solaron. Other examples include: Moody’s takeover of Vigeo Eiris and 427 and Oekom, which was acquired by ISS. We refer to Walter (2020) for an overview of the ESG ratings industry and to Escrig-Olmedo et al. (2019) for a review of its recent evolution. Relatedly, the survey of Grewal and Serafeim (2020) gives details on measuring, managing and communicating corporate sustainability performance.
In Figure 2.1, we plot the relative amount of Google queries through time for online searches of the terms CSR and ESG. It shows that the term CSR has been more popular on average in the past 15 years, but the recent trend is in favor of ESG. One reason for that is that the acronym ESG is progressively becoming mainstream in corporate reporting standards and, consequently, in investors’ jargon.
library(gtrendsR)                 # Package for Google trends
library(lubridate)                # Package for date management
trends <- gtrends(                # Extract data
    keyword = c("ESG", "CSR"),    # For keywords ESG and CSR
    time = "all")                 # Over all time periods

trends[[1]] %>%
    mutate(year = year(date)) %>%
    group_by(year, keyword) %>%
    summarise(score = mean(hits)) %>%
    ggplot(aes(x = year, y = score, group = keyword, color = keyword)) +
    geom_line() + geom_point(aes(shape = keyword), size = 2) + theme_light() +
    scale_color_manual(values = c("#688185", "#000000")) +
    theme(text = element_text(size=15)) +
    annotate(geom = "text", x = 2006.5, y = 25, label= "ESG not yet \n a green acronym", color="black", size = 4) +
    geom_segment(aes(x = 2004, y = 24.8, xend = 2009, yend = 24.8), color = "black", linetype = 2) +
    geom_segment(aes(x = 2009, y = 24.8, xend = 2015, yend = 24.8), color = "black", linetype = 2) +
    geom_segment(aes(x = 2004, y = 22, xend = 2004, yend = 28), color = "black", size = 1.5) +
    geom_segment(aes(x = 2009, y = 22, xend = 2009, yend = 28), color = "black", size = 1.5) +
    geom_segment(aes(x = 2015, y = 22, xend = 2015, yend = 28), color = "black", size = 1.5) +
    annotate(geom = "text", x = 2012, y = 25, label= "ESG  \n slow diffusion", color="black", size = 4) +
annotate(geom = "text", x = 2017, y = 25, label= "ESG \n acceleration", color="black", size = 4) 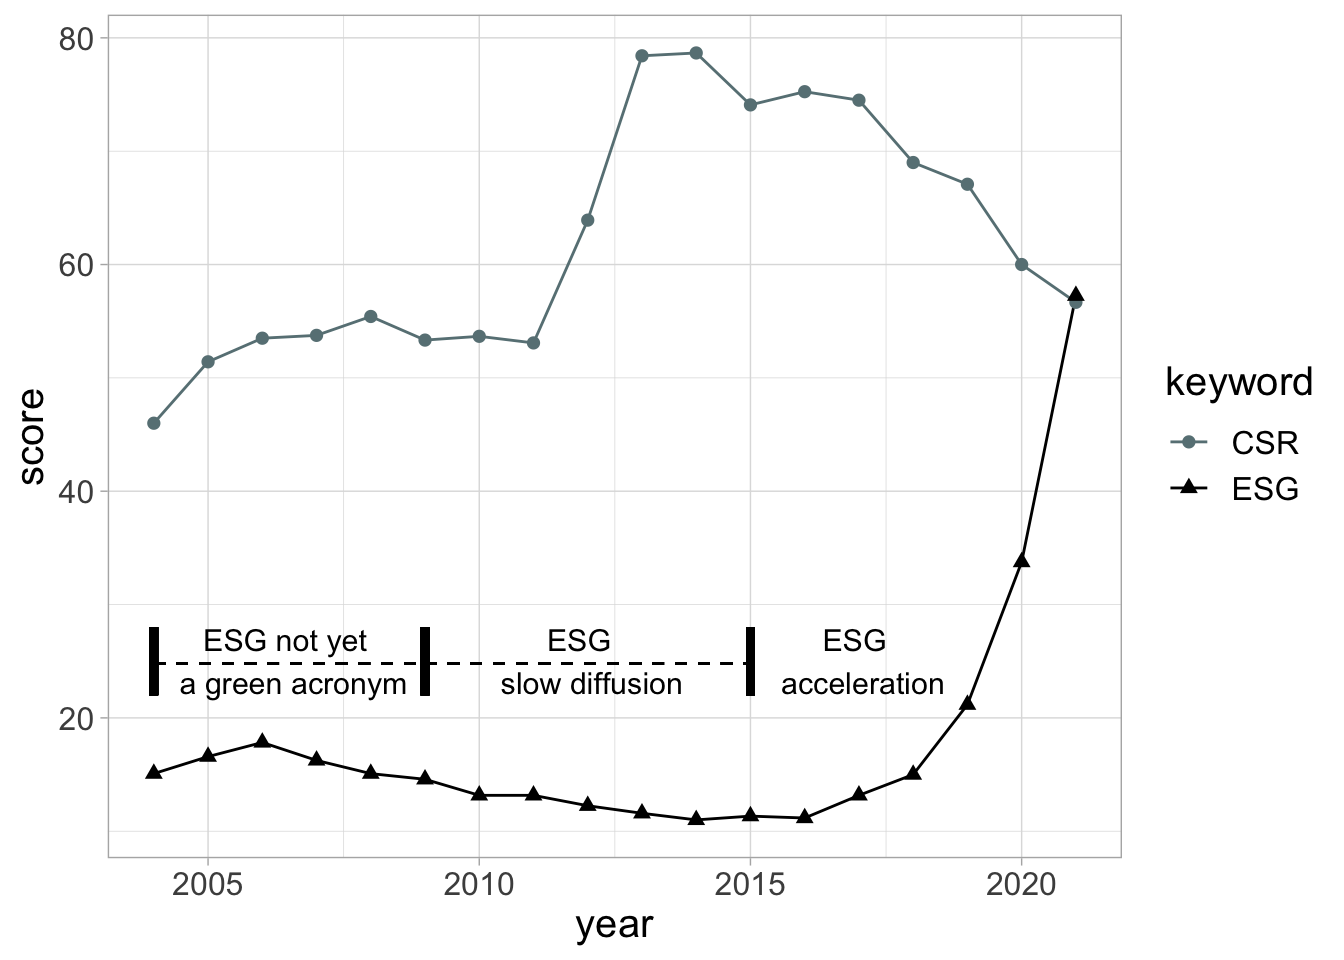
FIGURE 2.1: Online queries of keywords through time: average annual Google Trends metrics for the terms CSR and ESG.
The jargon is typically an aspect of sustainability which has thrived. It has become hard to navigate inside the universe of ESG agencies, boards, labels, non-profit organizations, initiatives, principles, regulations, etc., as they encompass a growing number of acronyms. We list a few in Table 2.1.
| Acronym | Meaning | Information |
|---|---|---|
| BSR | Business for Social Responsibility | A group of experts and firms dedicated to building a sustainable world. |
| CDP | Carbon Disclosure Project | A not-for-profit charity that helps investors, companies, cities, regions to manage their environmental impacts. |
| CDSB | Climate Disclosure Standards Board | An international consortium of business and environmental NGOs. |
| CSRD / NFRD | Corporate Sustainability Reporting Directive / Non-Financial Reporting Directive | A European directive that applies to large firms. The CSRD replaced the NFRD. |
| GRI | Global Reporting Initiative | An international independent standards organization that helps businesses and governments understand and communicate on their ESG impacts. |
| IIGCC | Institutional Investors Group on Climate Change | A European membership body for investor collaboration on climate change. |
| IIRC | International Integrated Reporting Council | A global coalition that advocates sustainable goals for corporate reporting. |
| SASB | Sustainability Accounting Standards Board | A non-profit organization that seeks to develop sustainability accounting standards. |
| SDG | Sustainable Development Goals | A blueprint from the United Nations (UN) to achieve a better and more sustainable future for all. |
| SFDR | Sustainable Finance Disclosure Regulation | A set of EU rules which aim to make the sustainability profile of funds more transparent and comparable. |
| TFCD | Task Force on Climate-Related Financial Disclosures | A group that develops recommendations for more effective climate-related disclosures. |
| UNEPFI | United Nations Environment Programme Finance Initiative | A partnership between United Nations Environment Program (UNEP) and the global financial sector to mobilize it toward sustainable development. |
| UNGC | United Nations Global Compact | A voluntary initiative based on CEO commitments to implement universal sustainability principles. |
| UNPRI | United Nations Principles for Responsible Investment | An international network of investors working together to implement its six aspirational “Principles” (see below) |
The six principle of the UNPRI:
- To incorporate ESG issues into investment analysis and decision-making processes.
- To be active owners and incorporate ESG issues into ownership policies and practices.
- To seek appropriate disclosure on ESG issues by the entities in which they invest.
- To promote acceptance and implementation of the Principles within the investment industry.
- To work to enhance their effectiveness in implementing the Principles.
- To report on their activities and progress towards implementing the Principles.
Haack and Rasche (2021) argue that sustainability standards may suffer from a paradox. The standard setters may be tempted to fix low bars in order to accelerate diffusion, but at the same time, weak requirements lead to attenuated impact and legitimacy.
2.1 Overview of ESG issues
2.1.1 Traditional issues
At the company level, ESG data is most often disclosed and analyzed via annual reports. Because there is no regulatory obligation to unveil particular metrics, the amount of information which is available can vary significantly from one firm to another. This variety is such that thousands of fields are reported by ESG data vendors. To simplify a landscape that is hard to fathom for laypeople, it is customary to group indicators by issues, and we provide one such categorization in Figure 2.2 (much inspired from Bloomberg). Each E, S and G pillar is decomposed in a handful of sub-themes which are aggregated to yield a global score (one for each pillar).
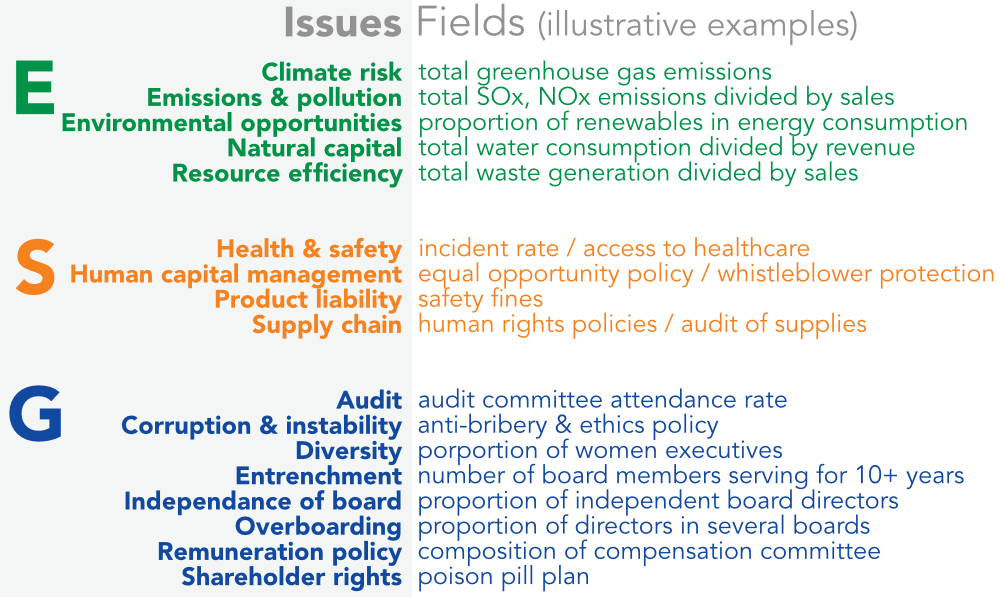
FIGURE 2.2: Representative categorization of ESG issues (and examples of related fields)
Naturally, as the interest in ESG intensifies and firms are incentivized to disclose more and more information, the coverage in fields increases. The propensity to disclose ESG information has naturally been shown to be linked to governance (see Michelon and Parbonetti (2012), Ooi et al. (2019), Chouaibi, Chouaibi, and Zouari (2021) and Hoang et al. (2021)). Disclosure can be assimilated to an act of good faith and is rewarded (Yoo and Managiy (2021)). In addition, Riordan and Nerlinger (2021) find that firms that disclose carbon emissions benefit from better liquidity (lower bid-ask spreads).
The Carbon Disclosure Project is an initiative that helps investors, companies, cities, states and regions quantify their environmental impact. Each year, they receive information from firms that assess their footprint on the environment. As is depicted in Figure 2.3, the amount of data they have received has increased steadily since the inception of the project in 2003. However, as is also shown, there are major differences in field type. Carbon data is now widely disclosed, but more exotic metrics (e.g., related to forests) are less covered. One reason for that could be that in some sectors, these exotic metrics may not be relevant.
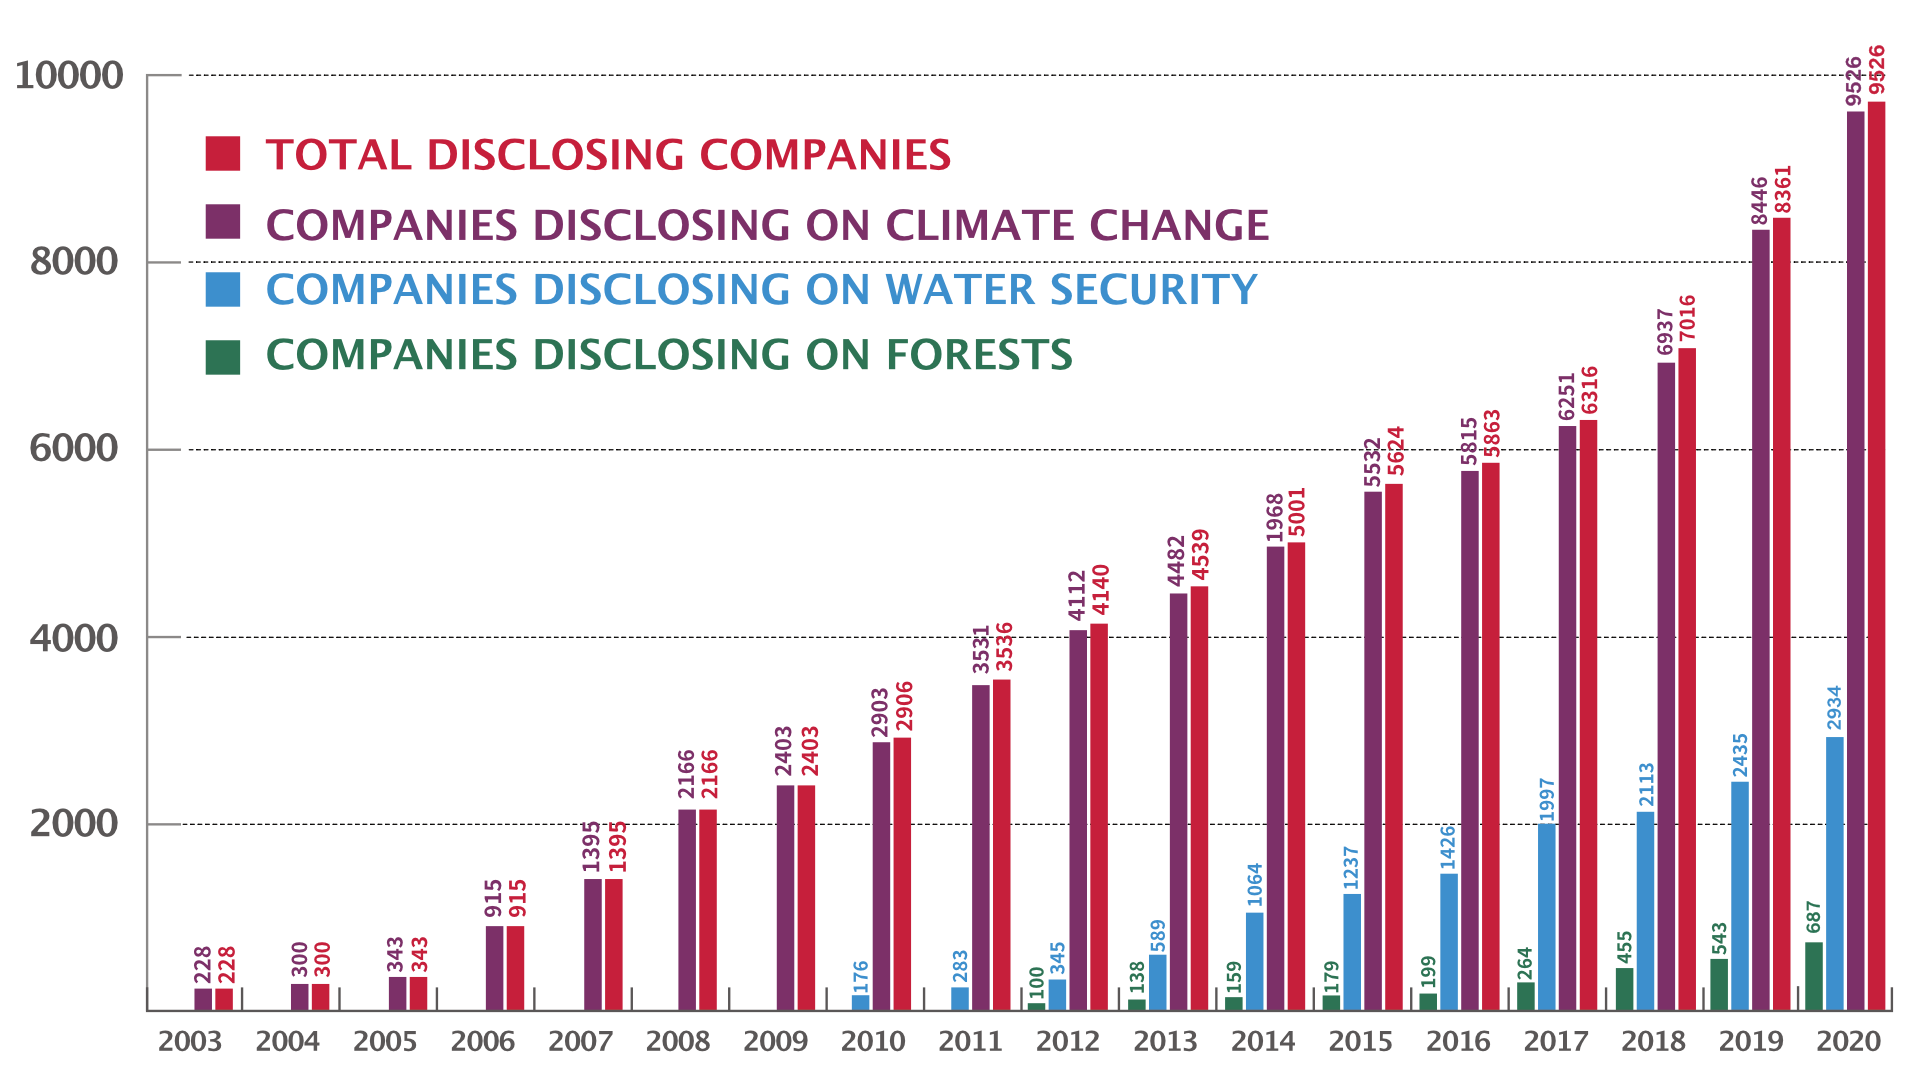
FIGURE 2.3: Evolution of coverage. This graph comes from the Carbon Disclosure Project (CDP - https://www.cdp.net). Each year, the CDP gathers information from firms that voluntarily disclose environmental related data. The above plot shows the increase in data inflow (across several topics) experienced by the CDP.
As is clear in Figure 2.3, climate change metrics are among the fields that are the most reported by companies. However, within these indicators, there are many subcategories. For instance, climate change may refer to various elements for a corporation. It can refer to given policies, like having a dedicated team or person in charge of the issue, or adhering to international standards, like those listed in Table 2.1. It can also point to emissions.
There are many emissions that firms can report. For instance, sulfur oxides (SO\(_x\)) and nitrogen oxides (NO\(_x\)) are highly polluting, but they are not greenhouse gases, which are primarily responsible for global warming. Instead, they may cause acid or toxic rains and are of course hurtful both for the climate and human health (Bilsback et al. (2020)). Greenhouse gas (GHG) emissions, on the other hand, include carbon dioxide (CO\(_2\)), methane (CH\(_4\)), nitrous oxide (N\(_2\)O), and ozone (O\(_3\)). The ability to measure these emissions is critical to evaluate the link between human activities and climate change (see also Section 6.2 on this topic).
For a company, the amount of emissions it is responsible for (or linked to) is usually evaluated across three different scopes that encompass an increasing extent of activities:
-
Scope 1: Direct emissions, for instance, emissions from fuel consumptions in plants, or from non-electric vehicles used by employees.
-
Scope 2: Emissions linked to the electricity purchased by the firms (e.g., nuclear-driven versus coal-driven electricity).
- Scope 3: All other indirect emissions stemming from the value chain, from the supplier (e.g., purchase of raw materials) to the consumer (e.g., use of sold goods). In many cases (i.e., sectors), Scope 3 emissions represent the majority of emissions. Given the amount of stakeholders that are encompassed, Scope 3 emissions are very complicated to assess. There is no dominating paradigm, and Scope 3 values depend strongly on the methodology of the data vendor.
One major issue is that the value chain amounts for a very large portion of emissions, meaning that Scope 3 emissions often dwarf Scope 2 emissions. This is problematic because the bulk of the iceberg is the most important and the hardest to evaluate. We refer to Ducoulombier (2021) for more details on data related challenges of Scope 3 emissions, as well as their integration in portfolio allocation. Cheema-Fox et al. (2021) show that allocations based on Scope 3 emissions differ substantially from those based on more narrow scopes.
2.1.2 Missing data
In the ESG sphere, data providers often scrap information from public sources, such as companies’ annual reports. These documents are not standardized with respect to the non-financial fields they are expected to disclose. Therefore, some firms communicate on particular issues, while others do not. This naturally generates heterogeneity in the data that can be accessed.
In order to compute aggregate ESG scores, data vendors rank firms on many criteria, with zero being a low score and 100 the best possible one. The criteria are aggregated into sub-issues, which are compiled into issues, which are, in turn, averaged into the E, S and G pillars. When a given score is not available, the firm is awarded a zero value for the missing field.
Of course, it is possible to resort to imputation methods to replace these missing values. But this always requires to make some distributional assumption on the data. This is likely to impact the outcome of the imputation and may be detrimental if the assumption is incorrect. Sahin et al. (2021) propose another route. Instead of correcting missing points, they add a new pillar, the Missing pillar. This pillar computes the proportion of ESG information that is missing for each asset and corrects the proportion to take into account sector specificities (some industries report more than others). It is then easy to integrate this new pillar in portfolio objective functions (see Chapter 5.
If ESG fields are missing, but other accounting figures are available, D’Amato, D’Ecclesia, and Levantesi (2021) and Krappel, Bogun, and Borth (2021) show that machine learning can help build proxies for sustainability metrics.
2.1.3 Sovereign metrics
Finally, we briefly mention the topic of macro (i.e., sovereign) ESG. At the country level, it is possible to devise indicators that allow ranking nations with respect to sustainable criteria, one of them being the importance of ESG disclosure from a regulatory standpoint (see Singhania and Saini (2021a)). Moreover, it seems that in recent periods, disagreement with respect to such measures vanishes. For example, Bouye and Menville (2021) report that correlation between indicators are often above 80% when comparing alternative rating agencies, e.g., Fitch, Standard and Poor’s, and Moody’s. The ratings of these agencies are dissected with an ESG scalpel in Angelova et al. (2021) in order to determine how credit scores reflect sustainable risk factors. The link between sovereign sustainability (via the SDGs) and credit markets (bonds spreads) is investigated in Ten Bosch, Van Dijk, and Schoenmaker (2022) (who report a negative link: higher SDG measures imply lower spreads). A dynamic analysis of social and environmental footprints of countries is provided in Fanning et al. (2021).
Diaye, Ho, and Oueghlissi (2021) reveal positive long-term correlations between sovereign ESG and GDP per capita. Similar results are obtained for national income per capita in Gratcheva, Emery, and Wang (2021). These findings relate to the so-called Environmental Kuznets Curve (EKC) hypothesis, which posits an inverted-U-shaped relationship between pollution and per capita income (see Dinda (2004) for a survey). A stylized version of the curve is depicted in Figure 2.4. The empirical relevance of the curve can be questioned. J. He and Richard (2010), in their figure 2, show that, in Canada, the relationship between CO\(_2\) emissions and GDP is closer to the pessimistic scenario in Figure 2.4.
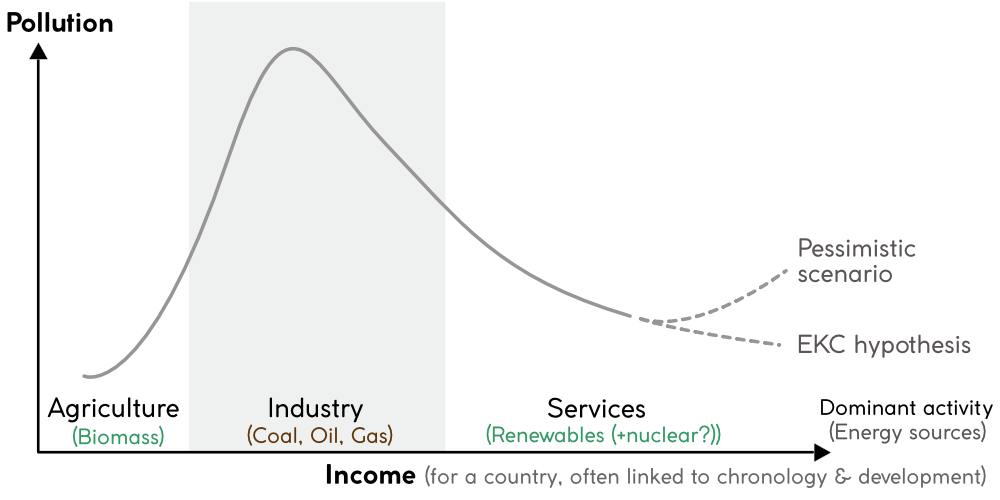
FIGURE 2.4: Environmental Kuznets Curve
A handful of articles link sovereign environmental, social and governance metrics to financial performance. Examples of such issues are:
-
Environmental: any type of polluting emissions per capita, consumption or production of coal and oil;
- Social: life expectancy, income inequality, Human Development Index;
- Governance: gender parity in the government, freedom of the press, control of corruption.
For instance, C.-L. Chang et al. (2020) perform Granger causality tests between stock returns and CO\(_2\) emissions and find that markets Granger-cause emissions, but that the reverse is false. A different facet of this topic is tackled by Morgenstern, Coqueret, and Kelly (2021), who resort to aggregate ESG scores to build macro trend-following strategies. They show that it is financially costless to improve a macro portfolio’s exposure to countries that have better ESG ratings.
A different use case of macro data is narrated in Cheema-Fox, Serafeim, and Wang (2021). The authors show that emerging markets are more vulnerable to physical risks (recorded in the International Disaster Database). Vulnerability is proxied by the Notre Dame Global Adaptation Initiative (ND-GAIN), which evaluates six dimensions: food, water, health, ecosystem services, human habitat, and infrastructure. These results can be exploited to form portfolios of currencies that outperform. Finally, Mooneeapen, Abhayawansa, and Khan (2022) counter-intuitively find that the ESG performance of firms is higher in countries with lower governance score (less democracy and less stability). Pineau, Le, and Estran (2022) link ESG and credit rating at the country level.
Field identifiers are easy to find on the website of the World Bank, e.g.: https://data.worldbank.org/indicator/EN.ATM.CO2E.PC
The last part is the code of the field. In this case, CO\(_2\) emissions per capita. Below, we prepare the map with the leaflet package.
library(WDI)                    # Package that accesses World Bank data
library(tmap)                   # Geographical plotting
library(countrycode)            # Package for country codes
library(leaflet)                # Package for maps
library(sf)                     # Shape files (sf) are a common geographical format

data("World")                   # From tmap!
names(World)[2] <- "country"    # Change the column name
emissions <- WDI(indicator = "EN.ATM.CO2E.PC", start = 2018, end = 2018) %>%
    na.omit()
names(emissions)[3] <- "emi_per_cap" # Change column name

datamap <- World %>%
    mutate(country = country %>% recode_factor(`Czech Rep.` = "Czech Republic")) %>%
    left_join(emissions, by = "country") %>%
    mutate(emi_per_cap = round(emi_per_cap,1))
# Below we code the color palette for the map
palet <- colorBin("YlGnBu",                                         # Yellow-Green-Blue palette
                  domain = datamap %>% pull(emi_per_cap),           # Domain of labels: emi_per_cap
                  bins = c(0, 1, 2, 5, 10, 15, 20))                 # value categories
# Below we code the labels on the map
labels <- sprintf(                                                  # Below we define the labels
  "<strong>%s</strong><br/>%g MtCO2/inhab.",                        # Adding text to label
  datamap$country,                                                  # We show the country name...
  datamap$emi_per_cap                                               # ... and the life expectancy
) %>% lapply(htmltools::HTML)                                       # Embedded all into html language
We are now ready to proceed with a plot of CO\(_2\) emissions per capita in Figure 2.5.
datamap %>%
  data.frame() %>%                                # Turn into dataframe (technical)
  sf::st_sf() %>%                                 # Format in sf
  st_transform("+init=epsg:4326") %>%             # Convert in particular coordinate reference
  leaflet() %>%                                   # Call leaflet
  setView(lng = 0, lat = 20, zoom = 2) %>%        # Centering & zooming
  addPolygons(fillColor = ~palet(emi_per_cap),    # Create the map (colored polygons)
              weight = 2,                         # Width of separation line
              opacity = 1,                        # Opacity of separation line
              color = "white",                    # Color of separation line
              dashArray = "3",                    # Dash size of separation line
              fillOpacity = 0.7,                  # Opacity of polygon colors
              highlight = highlightOptions(       # 5 lines below control the cursor impact
                weight = 2,                       # Width of line
                color = "#EEEEEE",                # Color of line
                dashArray = "",                   # No dash
                fillOpacity = 0.9,                # Opacity
                bringToFront = TRUE),
              label = labels,                     # LABEL! Defined above!
              labelOptions = labelOptions(        # Label options below...
                style = list("font-weight" = "normal", padding = "3px 8px"),
                textsize = "15px",
                direction = "auto")
  ) %>%
  leaflet::addLegend(pal = palet,           # Legend: comes from palet colors defined above
            values = ~emi_per_cap,          # Values come from lifeExp variable
            opacity = 0.9,                  # Opacity of legend
            title = "Map Legend",           # Title of legend
            position = "bottomright")       # Position of legend
FIGURE 2.5: Illustration of sovereign ESG: CO2 emissions per capita.
It is relatively easy to adapt the code to other indicators. We plot corruption control below and use a different package for geocomputing.
library(WDI)
library(tmap)
library(viridis)
data("World")
data_corruption <- WDI(indicator='CC.EST', start = 1960, end = 2020) %>%
    filter(year == 2019)

geo_data <- map_data("world")
geo_data$region[geo_data$region == "USA"] <- "United States"
geo_data$region[geo_data$region == "Russia"] <- "Russian Federation"
geo_data$region[geo_data$region == "Iran"] <- "Iran, Islamic Rep."
geo_data$region[geo_data$region == "Egypt"] <- "Egypt, Arab Rep."
geo_data$region[geo_data$region == "Venezuela"] <- "Venezuela, RB"
geo_data$region[geo_data$region == "Democratic Republic of the Congo"] <- "Congo, Dem. Rep."
world_map <- geo_data %>%
    left_join(data_corruption, by = c("region" = "country"))  %>%
    rename(corruption_control = CC.EST)
world_map %>%
    ggplot(aes(x = long, y = lat, group = group)) +
    geom_polygon(aes(fill = corruption_control), colour = "white") +
    theme_light() +
    scale_fill_viridis() +
    theme(legend.position = c(0.15,0.3)) +
    ylim(-55,83)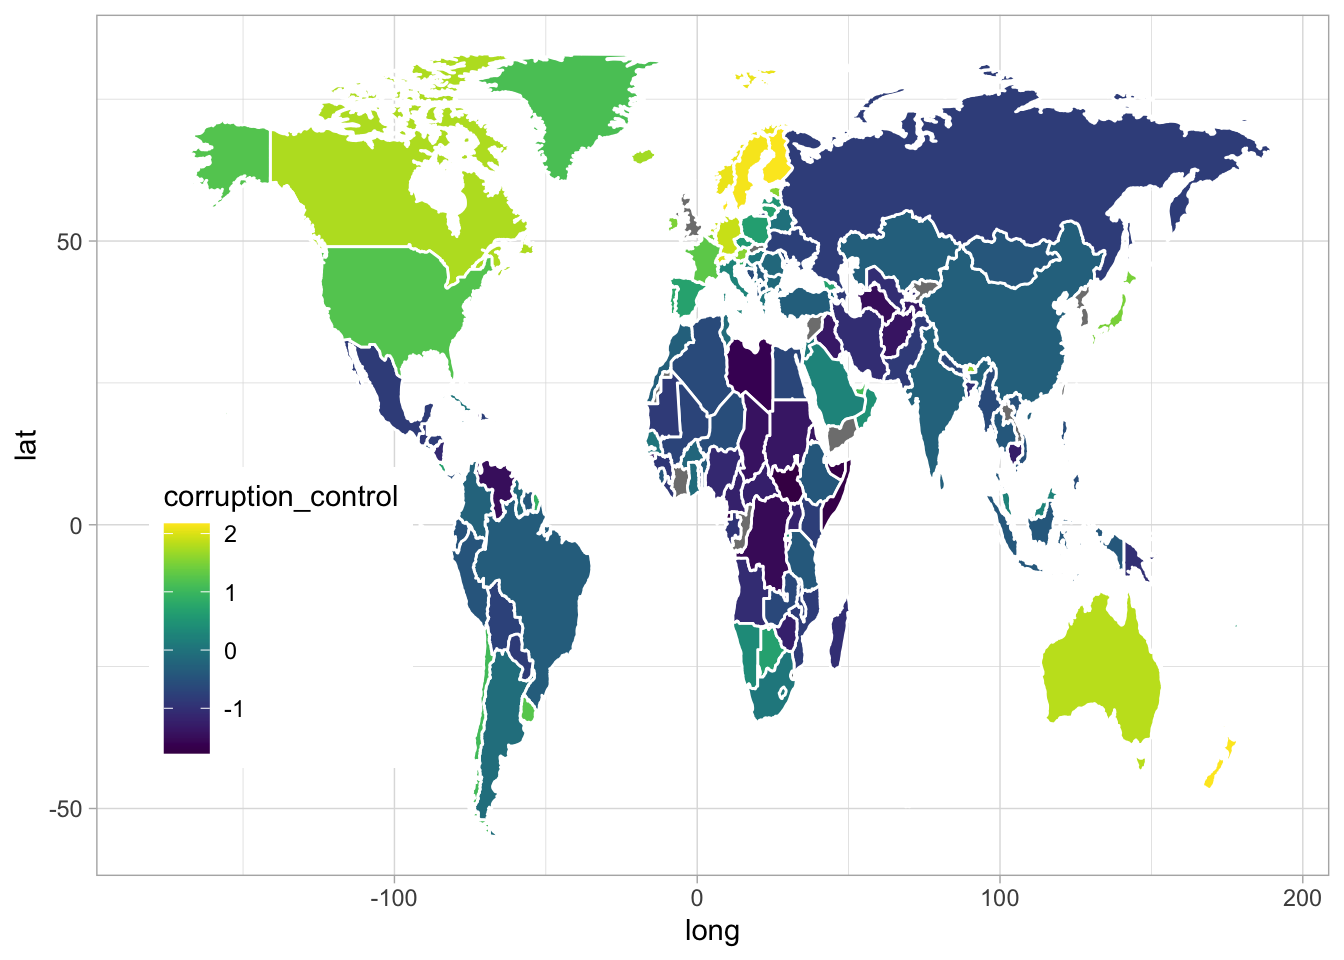
FIGURE 2.6: Illustration of sovereign ESG: corruption control.
2.2 Rating disagreement
The aim of ESG data is to measure and assess the performance of corporations on a large set of issues, which are often categorized according to the environment, social and governance trichotomy. The importance of this data (and its quality) can hardly be overstated, as it drives the decisions of all SR investors around the world. However, with abundance and variety comes heterogeneity: it is not uncommon that rating agencies disagree in their conclusions. This may cause headaches, as a strategy’s returns (or any study’s conclusions) can very well change when switching from one data provider to another. Disagreement is well documented not only for firms, but also for funds (Gangi et al. (2022)).
This issue is not new (see J. J. Griffin and Mahon (1997)), and it is a well-documented inconvenience for portfolio construction, as is for instance shown in F. Li and Polychronopoulos (2020), Madison and Schiehll (2021) and Schmidt and Zhang (2021): discrepancies in ratings yield diverging performances. Notably, substituting one data vendor for another may shift the investment universe when applying green filters (Billio et al. (2021)). In fact, this lack of consistence may very well deter investors to join the ESG bandwagon (Mooij (2017b)). All is not necessarily lost though: Lopez, Contreras, and Bendix (2020a) find that ratings seem to agree at least on the worst ranked companies.
An informative starting point is the paper of Widyawati (2020), which compiles a literature review on ESG metrics in which the author shows the complexity of the playing field. It is notably argued that discrepancies in data collection procedures and methodological choices may lead rating agencies to score the same company very differently. Furthermore, Berg, Koelbel, and Rigobon (2020) and Abhayawansa and Tyagi (2021) analyze the reasons why different ESG data providers may disagree on a firm’s rating. Both articles find that the main drivers of divergence are the scope of categories considered and the measurements methods used. The scope relates to the theoretical definitions that are given to particular fields and topics (e.g., emissions or gender parity), while the measures pertain to the actual metrics and data sources used to compute these fields. According to Gyönyörová, Stachoň, and Stašek (2021), these divergences depend on countries and industries. In addition to the pure ESG trichotomy, the Sustainable Development Goals (SDGs) are also entering in the objective functions of investors (see De Franco, Nicolle, and Tran (2021)). Furthermore, Lyon et al. (2018) push even further and contend that firms should also disclose their political activities (party funding notably).
As reported by Dimson, Marsh, and Staunton (2020a), one other reason for disagreement is the difference in weights that are assigned (by agencies) to the three pillars of ESG. Chatterji et al. (2016) also document the heterogeneity in the conclusions of raters and Kotsantonis and Serafeim (2019) list four challenges that SR investors face when they resort to ESG scores: data inconsistencies, difficulty of benchmarking, risk of imputation and rating divergence (across agencies). As one could expect, disagreement blurs the efficiency of predictive models based on ESG signals. Serafeim and Yoon (2021a) find that scores based on average ESG metrics (across providers) predict future ESG news, but that disagreement (dispersion in metrics) reduces accuracy. Christensen, Serafeim, and Sikochi (2021) report that disclosure is also a driver of disagreement and that, surprisingly, higher disclosure leads to more disagreement. When rating agencies have a lot of data at their disposal, this may give them more room for interpretation and for data processing. There are also contingencies: L. Zhang (2021) finds that some pillars are more affected (S and G) and that industries are also not equally impacted.
For theoretical considerations on rating disagreement and its impact on asset prices, we point to Gibson et al. (2021) and Avramov, Cheng, et al. (2021). The latter show that disagreement, when measured by the volatility of the ESG score, can have a strong impact on a firm’s alpha because it impacts the effective level of risk aversion. Empirically, Gibson et al. (2021) find that disagreement between agencies is favorable for returns when ratings pertain to environmental measures, but unfavorable when they relate to governance and social issues.
2.3 Measurement issues and stability
Beyond quality and trustworthiness, an important property that investors seek in ESG ratings is stability. When investing in best-in-class firms, they both want to reward sustainable policies and to signal that SRI is one of their key priorities. However, if ESG scores fluctuate, it is hard to be confident that the choices that are made at time \(t\) remain valid and relevant at time \(t+1\). Moreover, if raters reverse their rankings, investors might get confused (Pelizzon, Rzeznik, and Weiss-Hanley (2021)).
For instance, Chatterji, Levine, and Toffel (2009) contend that ESG metrics are most of the time reflections of past corporate policies but sometimes fail to predict future corporate behavior.7 In fact, it is shown in In, Park, and Eccles (2020) that this depends on the data source and vendor. Utz (2019) confirms that it is very hard to predict corporate scandals from ESG data. R. Yang (2021) paints an even darker picture and finds that higher environmental ratings predict increased future unsustainable behavior! In a similar vein, Gidwani (2020) finds that ESG scores are mean-reverting, which complicates the task of ESG-based allocation.
One related issue is the overwriting of scores a posteriori. Berg, Fabisik, and Sautner (2021) show that ESG ratings are rewritten through time and that past values are likely to be altered by agencies, so that depending on when the data was downloaded, values may very well change. This is one explanation, among many others, why research may fail to reach a consensus on the impact of ESG on financial, social, and environmental performance.
Finally, we mention that text processing and natural language processing (NLP) is increasingly used for multiple purposes, from analyzing corporate reports to crafting sentiment indicators and evaluating firms’ exposures. This allows to generate high frequency data, whereas ESG indicators are usually disclosed at annual frequencies. We refer to S. Cao et al. (2020), Nugent, Stelea, and Leidner (2020), Raman, Bang, and Nourbakhsh (2020), Serafeim (2020), Taleb et al. (2020), M. Chen et al. (2021), Dor et al. (2021) (for job postings) and K. Li and Yu (2022) for examples of applications.
2.4 Greenwashing
Greenwashing refers to the practice whereby firms selectively disclose the information that is used to generate ESG ratings.8 For instance, firms may deceitfully use labels or standards, such as the United Nation’s Sustainable Development Goals to signal ethical conduct (see Lashitew (2021)). One way to artificially reduce a firm’s carbon emissions is simply to outsource them abroad (R. Dai et al. (2021)), which impact low scope definitions of emissions, but not third-level scopes (see Section 2.1). The opposite of this practice is to commit to science-based emission targets (see Freiberg, Grewal, and Serafeim (2021)).
The article by Lyon and Montgomery (2015) offers a survey of such practices and a taxonomy of greenwashing. Typically, one reason why some firms resort to CSR is to signal quality in adverse situations (Gao, He, and Wu (2021), Ferrés and Marcet (2021), DasGupta (2021)).9 The studies by Laufer (2003), Delmas and Burbano (2011), Roulet and Touboul (2015) and Marquis, Toffel, and Zhou (2016) reveal some drivers of this phenomenon. The second study identifies four types of drivers: market external drivers (e.g., consumers), other external drivers (activists), organizational drivers (incentive culture) and psychological drivers (narrow framing). Roulet and Touboul (2015)} (p. 318) conclude that “paradoxically, beliefs in favor of individual responsibility tend to push firms toward less greenwashing and with a true aspiration to do good, while beliefs in favor of competition lead managers toward egoistic greenwashing strategies based on a gestural commitment only.” There is documented evidence (Haque and Ntim (2018)) that, often, firms adopt green postures, e.g., by adhering to a sustainable initiative (GRI, UNGC), but fail to improve environmental impact substantively.
Greenwashing is unanimously condemned by all stakeholders in the field of sustainable investing. The reason is clear: by disclosing forged numbers, firms introduce noise in the decision process of investors. This is likely to affect not only the true carbon footprint of their portfolios, but also, possibly, the realized financial performance. Delmas and Burbano (2011) categorize firms along two dimensions: their effective environmental impact and policies on one hand, and their level of communication on the other hand, see Table 2.2 below.
| The table is based on Delmas and Burbano (2011) |
|---|
| Communication | True environmental type | |
|---|---|---|
| Brown firms | Green firms | |
| Strong communication | Greenwashing | Vocal green |
| No communication | Silent brown | Silent green |
Counter-intuitively, Marquis, Toffel, and Zhou (2016) find that corporations that tend to pollute more are particularly likely to eschew selective disclosure, especially if they originate from a country in which ESG scrutiny is high. They are sometimes those that invest the most in green projects, especially in the energy industries (Cohen, Gurun, and Nguyen (2020)). At the other end of the spectrum, E.-H. Kim and Lyon (2015) introduce the notion of brownwashing (undue modesty, which is not quite equivalent to the silent green firms in Table 2.2). The authors find that a company’s growth (endogenous for the firm) and a deregulated environment (exogenous for the firm) are two key variables that influence the decision to indulge in greenwashing or brownwashing.
At the fund level, some managers can be tempted to benefit from ESG labels and expositions without truly improving their ESG footprint (see, e.g., S. Kim and Yoon (2020)). One notable consequence of such practices is that if past ESG scores are not correlated to future sustainable footprints, then SRI may not be as effective as one could hope (Gibson et al. (2020)). Fortunately, the study of Du (2015) reveals that greenwashing firms end up being penalized once their greenwashing activity is revealed. This phenomenon is negatively associated with financial returns (the study is based on a sample of Chinese firms).
To conclude, we also mention the practice of greenwashing in the financial industry. In Brandon et al. (2021), the authors show that in the US, institutions that publicly commit to responsible investing in fact do not. Some so-called ``green’’ American investors even have worse ESG scores than ESG-independent institutions. This is also reported by Kaustia and Yu (2021) and Candelon, Hasse, and Lajaunie (2021) for the mutual fund industry and Couvert (2020) corroborates this by analyzing voting patterns of mutual funds. Because firms know that they are being watches by analysts on their ESG reporting, they are incentivized to be very careful about the numbers they disclose. In and Schumacher (2021) lay out a very detailed account of how they can alter their performance on carbon emissions.
2.5 Green firms
There is obviously no unambiguous definition of green firms. Sustainability can be measured in many dimensions and the latter often tell different stories. By default, we are bound to assess degrees of greenness.10 For instance, a major oil producer may pledge to shift its entire research and development (R&D) effort towards renewable energies. This is in fact a reasonable thing to do (see Brown, Martinsson, and Thomann (2022)). By its current situation, the firm is undoubtedly brown, but the direction it is willing to take may attenuate the judgment. Moreover, from an investor’s standpoint, funding green patents is somewhat a hedge against risks related to carbon taxes. It seems evident that many firms are now headed in this direction, or at least want the public to think that. In their analysis of the mission statements of European firms, Zumente and Bistrova (2021)} find that these statements have evolved, on average, toward more sustainable goals.
Even if green corporations are hard to define, academic studies can again provide some cues. For instance, Diez-Busto, Sanchez-Ruiz, and Fernandez-Laviada (2021) review the literature on the B-Corp movement and detail its main topics and issues: for instance, the factors that lead to certification on one hand, and the social efficiency of B-Corporations on the other.
The motivations that drive companies towards sustainability are well documented. In their seminal article on CSR, McWilliams and Siegel (2001) mention various factors that are likely to drive a firm’s appetite for sustainability. The abstract mentions the following attributes: size, level of diversification, research and development, advertising, government sales, consumer income, labor market conditions, and stage in the industry life cycle.
Nevertheless, governance seems to be the focal angle in academia and the composition of boards is a recurring subject.11 Hoang et al. (2021) find that some board characteristics matter for environmental performance (CEO-chairman duality, gender diversity, board member age), while others don’t (board size). Velte (2016), Jaehong Lee and Kim (2021) and Godfrey et al. (2021) report that having more women on boards implies better ESG performance, or mitigates the risk of brown policies. Indeed, as Haque (2017) conclude, board independence and board gender diversity are positively linked with carbon reduction initiatives. Moreover, climate disclosure increases with female representation (see Ooi et al. (2019)). From a valuation standpoint, this can be beneficial to firms, as J.-K. Kang et al. (2021) report that so-called activist directors (appointed through shareholder activism events) are linked with large firm value increases.
However, the study of Moussa et al. (2020) attenuates these findings by revealing that board characteristics only play a role (in the reduction of pollution) if the firm has a carbon strategy. Relatedly, Bento and Gianfrate (2020) show that gender representation among directors and independence of board members is linked to internal carbon pricing (which penalizes intensive carbon activities), but so are other exogenous factors, such as revenues, profitability, and GDP per capita of the firm’s country. The study Bu et al. (2021) introduces lesser known concepts. First, it focuses on the role of talented inside directors (TIDs), who are inside directors with outside directorship. Second, the dependent variable is the residual CSR that cannot be attributed other factors, such as advertisement, R&D, cash flows, etc. Surprisingly, the authors call this residual the excess CSR and show that the presence of TIDs negatively relates to excess CSR. The authors conclude that TIDs are beneficial for firms because they prevent CEOs from engaging in too much CSR (thereby implying that there is such thing as too much CSR).
Whether so-called green firms are actually green (or remain green) is another topic. This relates to the stability of ratings mentioned in Section 2.3. When a firm is rated as highly environmentally friendly, we should anticipate the rating to stay high, and, relatedly, we should expect green policies from the top management. However, in their staggering study, Elmalt, Igan, and Kirti (2021) reveal that firms with higher ESG scores are only weakly linked to lower carbon emissions. A more positive note comes from Saeed et al. (2021) who find that, in the energy sector, firms with a CSR committee pollute less. This topic is also linked to the type of strategy that is taken by the firm. For instance, Banker et al. (2022) discriminate between innovation differentiation (actually doing something) and marketing differentiation (communication effects, akin to greenwashing). The first is likely to boost CSR performance, but not the latter.
2.6 Ad-hoc solutions
First of all, in order to circumvent the obstacle of divergent ratings, some investors have decided to build their own in-house metrics (see Serafeim and Grewal (2017)). A second way to mitigate divergence is aggregation: Jacobsen, Lee, and Ma (2019) advocate ratings combination, which reduces dispersion and measurement errors. Berg, Kölbel, and Rigobon (2022) also find that several ratings are beneficial, even if some of them are noisy. A similar attempt in this direction is the work of Gibson and Krueger (2018), which introduces an aggregate metric (at the portfolio level) of sustainability footprint. This is also intended to help investors measure the ESG impact of their investments.
Another issue is missing data, which often occurs when smaller firms do not disclose any ESG-related information. In this case, Henriksson et al. (2019) argue that it is possible to construct an ESG long-short factor and evaluate which individual stocks load heavily on it. This allows to build a proxy for ESG exposure. Görgen et al. (2020) and Roncalli et al. (2020), roncalli2021market also follow this route and construct a brown minus green (BMG) factor so as to assess a firm’s exposure via the beta coefficient with respect to this factor. It is then possible to score firms even when they do not disclose data related to their sustainability policies. Whether such metrics are faithful reflections of ESG standards remains an open question.
In a different direction, Gaganis et al. (2021) propose that banks use their unique position to craft in-house indicators. They argue that banks should evaluate corporate borrowers along ESG lines and their paper proposes a methodology to do so.
We end this subsection with a short list of further contributions. To mitigate some of the aforementioned issues, Fiaschi et al. (2020) propose a quantitative (quantile regression based) solution to improve the measurement of corporate wrongdoing. Another stream of the literature examines the drivers of the propensity to disclose ESG data. For example, Rezaee and Tuo (2019) argue that ESG reporting is linked to the quality of earnings (while Jia and Li (2021) link corporate sustainability to the persistence in earnings). Other useful insights and pieces of advice on the handling of ESG data and its integration in the investment process can be found in Hallerbach et al. (2004), Kotsantonis, Pinney, and Serafeim (2016), Bender, Sun, and Wang (2017), Bender et al. (2018) and Cornell and Damodaran (2020). Finally, we end this subsection by mentioning the work of Mahmoud and Meyer (2020). The authors decompose the ESG ratings along three orthogonal axes: uncertainty, investor sentiment, and idiosyncratic sustainability. In their analysis of the COVID-19 crash, they show that the immunity of sustainable stocks is linked to the uncertainty factor more significantly than to the core sustainability axis.
2.7 Need for transparent and uniform reporting
The most efficient solution is probably when governments impose ESG reporting obligations, even though, in some cases, firms may find advantages to disclose their indicators and metrics in the absence regulatory constraints (Ioannou and Serafeim (2019)). In fact, some companies write corporate reports in such ways that they are favorably analyzed by automatic algorithms (S. Cao et al. (2020)), for instance by optimizing textual sentiment. In any case, ESG reporting will become paramount because investors will need more transparency (Meng (2021)) or ask for it (Rissman and Kearney (2019)). In the elegant and theoretical model of H. L. Friedman, Heinle, and Luneva (2021), sustainable reporting “informs investors about the firm’s outcomes and reduces their perceived risks” but “provides firms with incentives to manipulate investors’ perceptions.”
Because of the complex nature of all ESG dimensions, Kaplan and Ramanna (2021) suggest to start by focusing on the most consensual fields, such as emissions and indentured labor in supply chains. Krueger et al. (2021) for instance document the benefits of mandatory disclosure, and as expected, it increases the availability and quality of ESG reporting. Furthermore, when firms are obliged to disclose, they start benchmarking as well, which leads to emission reductions (Tomar (2021)). This is also true for green mutual funds (J. R. Nofsinger and Varma (2021)). Recent advances in non-financial reporting are reviewed in Pronobis and Venuti (2021) and Harper Ho (2021), the latter being focused on the US.
This is all the more critical that easily found information is never as valuable as sophisticated and esoteric data (Bose (2020)). The simplest way to achieve this goal is to impose ESG reporting standards (Lopez, Contreras, and Bendix (2020b)). Currently, large firms, because they can devote more resources, have an edge with respect to ESG disclosure (Artiach et al. (2010), Drempetic, Klein, and Zwergel (2020) and see also R. P. Gregory (2022)). Moreover, according to M. Chen, Behren, and Mussalli (2021), “the amount of ESG data that is available for a given company is positively correlated with the commercial ESG rating of that company, and also the weighted average cost of capital for that company.”
The drivers of voluntary disclosure remain largely unknown, but the studies of Ooi et al. (2019), Yu and Van Luu (2021) and Chouaibi, Chouaibi, and Zouari (2021) seem to indicate that some governance characteristics play a role (e.g. size, independence, and diversity). Some initiatives have already blossomed, and they promote transparency and exhaustiveness in reporting, like the Task Force on Climate-related Financial Disclosures (TFCD),12 and efforts in this direction need to intensify, as is advocated in the roadmap of the Board (2021). Whether regulators, such as the SEC, have the legal authority to coerce firms to disclose non-financial information is discussed by Vollmer (2021).
However, there exists a risk of rating addiction (Cash (2018)): it is imperative not to fall in the trap of rating agencies and make sure that ratings are fair, rational and independent from corporate funding and conflicts of interest (Hoepner and Yu (2017b)). Tang, Yan, and Yao (2021) for instance find that raters tend to favor firms which share the same parent company. Sadly, transparency may not be in the interest of these agencies because their method is a large part of their intellectual property (Stubbs and Rogers (2013)).
To end this section on a positive note, Singhania and Saini (2021b) provides a comparative analysis of countries that have already imposed some regulations on non-financial disclosures. They typically find that European countries clearly lead the initiatives.